
 Genomic samples storage & distribution
 Large DNA Fragment cloning and characterization
 HMW DNA extraction
 Genome optical mapping
 Genome scaffolding using Hi-C
 Whole genome characterization
 Large DNA Fragment Capture
Genome scaffolding using Hi-C
Hi-C (high-throughput chromatin conformation capture) is a technique that allows exploring the three-dimensional structure of the genome by combining a proximity ligation technique and high-throughput sequencing.
Used in addition to HiFi PacBio sequencing, Hi-C data makes it possible to: (i) correct assemblies, (ii) orient and order contigs. The goal is to organize genome sequences at the chromosome level.
We work with 2 Hi-C kits : the Proximo Hi-C plant Kit from Phase Genomics ( https://phasegenomics.com/products/proximo/) and the Omni-C kit from Dovetail Genomics ( https://cantatabio.com/dovetail-genomics/products/omni-c/).
The first step in library preparation is the isolation of the nuclei and the fixation of the DNA in its 3D conformation. The DNA is then fragmented by enzymatic digestion (HindIII or sequence independent nuclease) and the cohesive ends of the restriction sites are filled with biotinylated nucleotides. After ligation of the new blunt ends, purification on streptavidin beads makes it possible to specifically isolate the DNA from contact regions.
Ligated with Illumina type adapters, the isolated DNA is firstly sequenced at low coverage as quality control (1M PE150 reads). After validation of this dataset by alignment of the reads on the genome, main sequencing generates 30X of data needed to scaffold PacBio contigs.
Aligning Hi-C data on the genome assembly allows visualizing spatial interactions between regions using contact maps. The contact maps are powerful tools to perform the genome scaffolding by ordering sequence contigs based on their spatial proximity.
Example of a contact map for the reconstruction of the 19 chromosomes of an Orobanche genome :
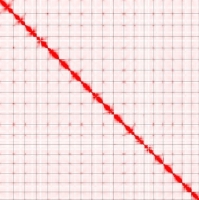
The horizontal and vertical axes represent positions along the genome. Each square represents a chromosome. Each pixel of the matrix corresponds to the interaction between two specific positions in the genome. Pixel colors indicate the intensity of interactions between genome positions. The darker red regions indicate more frequent interactions, while the lighter ones indicate less frequent interactions.
The main diagonal of the matrix (top left to bottom right) represents intrachromosomal interactions, showing how different parts of the same chromosome interact with each other.